⚙️How it works
Your ESP32 LoRa-APRS iGate already emits syslog. Repoint that one setting at the network and everything downstream is automatic — there's no per-operator configuration on my side.
Zero-touch & ownership-checked
A new gate that starts sending syslog is recognised by its callsign and immediately gets its own private data store. Before you get a login, though, you prove the gate is yours: you beacon a one-time code I issue at registration, and the network confirms it arrived through your gate. That keeps the spoofable nature of plain UDP from handing anyone else's data out.
📊What you get
A Grafana dashboard per gate, grouped under one login for your callsign. Edit it, rearrange it, even delete a panel — it's yours. (Delete the whole thing and a fresh copy self-heals within ~10 minutes.)
🗺️Coverage maps
Where you're being heard — direct contacts (green) shown apart from digipeater relays (orange, drawn to the relaying node), with reception lines, latest distance & RSSI per station and recency trails.
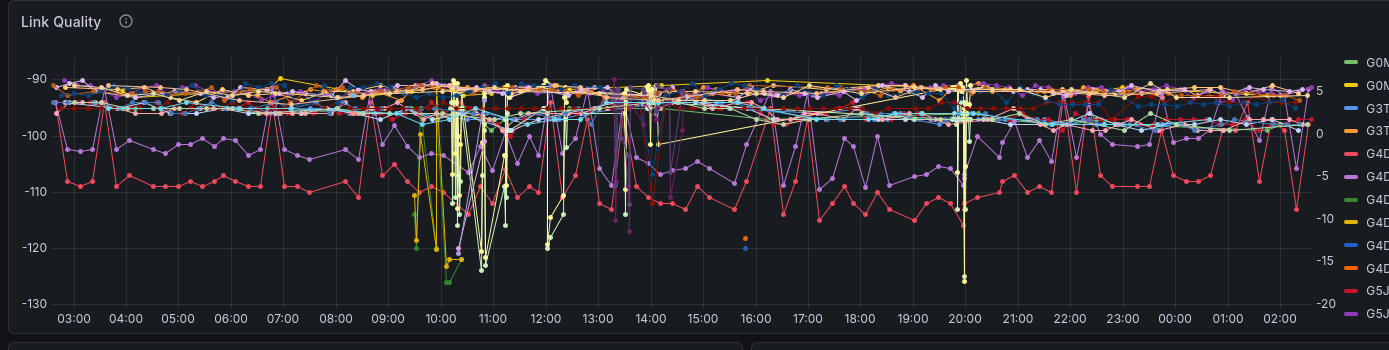
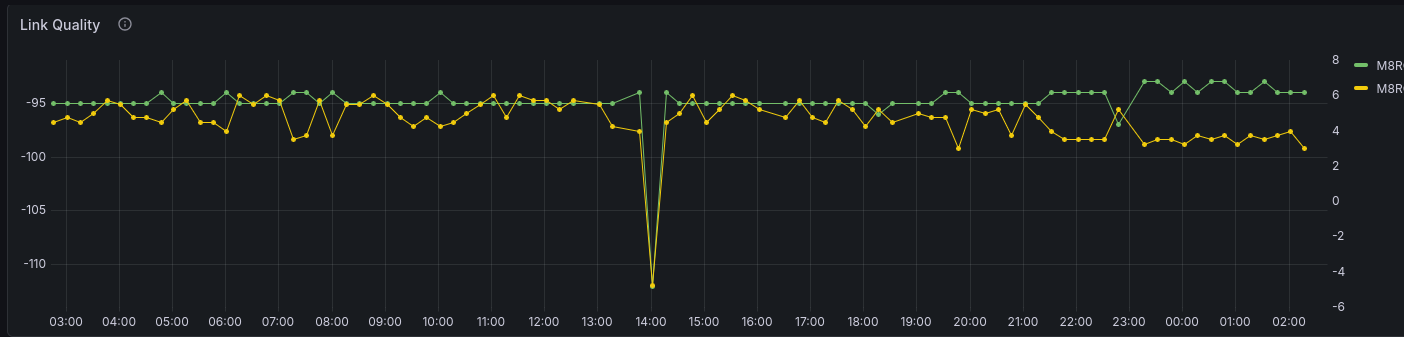
📶Signal & RF
Link quality, SNR-vs-distance, CRC rate and per-station averages — sorted weakest-first.
📡Activity
Packet rate, station activity, packet categories and your furthest-DX records, direct vs via-digi.
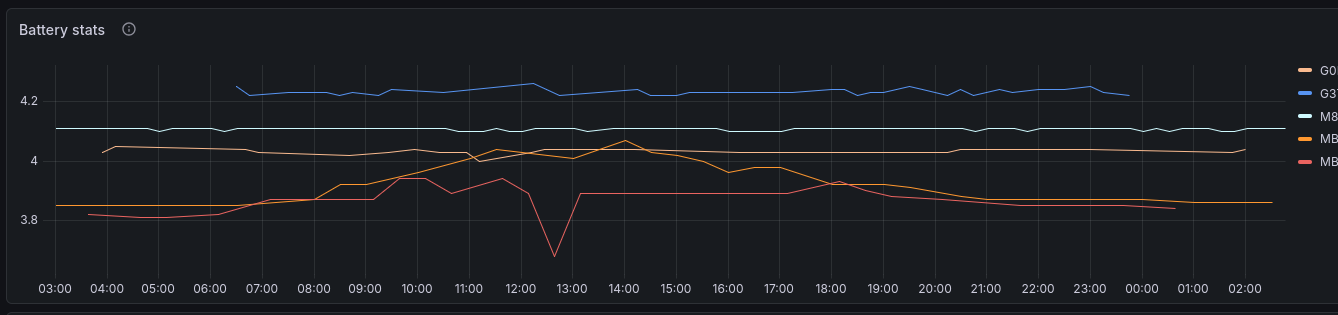
🔋Telemetry
Battery and device telemetry from heard stations, plus the raw recent-packets log.
🔒Isolation
You see only your own gates. Folders are locked per operator — no cross-tenant leakage.
➕Auto-expanding
Add another SSID later and its dashboard appears automatically — no re-registration needed.
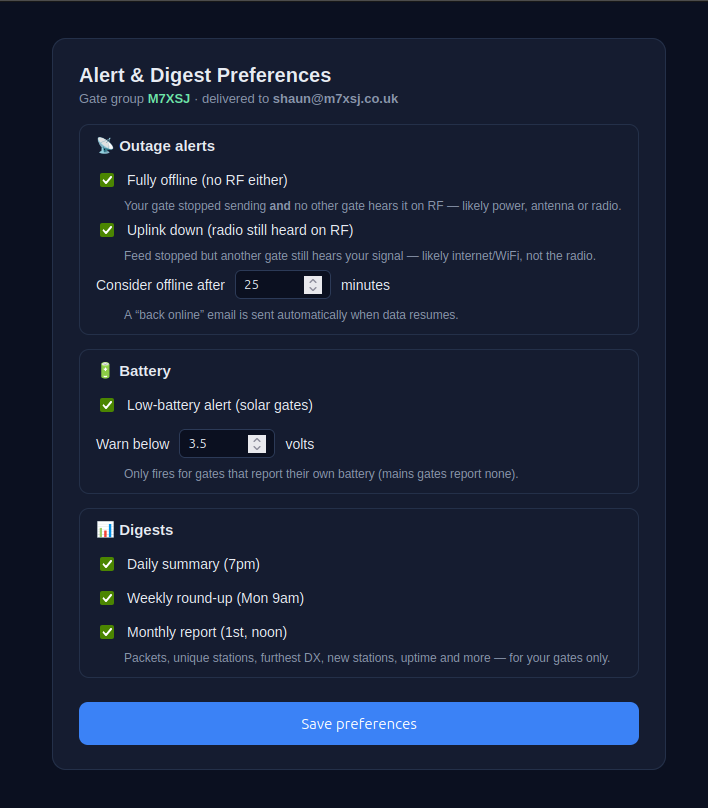
🔔Alerting
Alerts are per-operator and opt-in — everything is off until you switch it on. You choose which alerts you want and set your own thresholds on a secure, token-gated preferences page that's linked in every email the network sends you. State-change only (no spam), self-resolving, and only ever sent to your verified address.
Offline — radio-down vs uplink-down
When your feed goes silent past your threshold, the network checks whether another gate still hears you on RF. If not, it's a true radio/power/antenna outage. If yes, your radio is fine and your internet/uplink is the problem — and the email names the witness gate, how recently it heard you and at what signal.
Recovery
A “back online” email when packets resume, if you opted into either offline alert.
Low battery
Your gate's own reported voltage under your floor — useful for solar / off-grid sites. No battery sensor = never fires.
You're in control
Thresholds and on/off switches are yours, via the prefs link in your emails. If the whole network goes dark at once that's flagged as my infrastructure — you won't get a false "your gate is down" in that case.
📰Digests
Opt-in email summaries of your gates, on the cadence you choose — off by default, switched on from the same preferences page as your alerts. Like everything else, they cover your gates only.
📅Daily
A once-a-day recap each evening (7pm).
🗓️Weekly
The week in review, every Monday (9am).
📆Monthly
A full-month report on the 1st (noon).
🚀Join the network
- Register. n8n.m7xsj.co.uk/form/aprs — enter
CALLSIGN-SSID, name and email. You get a verification code (e.g.LORA123456). - Repoint syslog. On your iGate, set syslog server to
m7xsj.co.uk, port1516, protocol UDP. - Beacon the code. Put the code in your beacon comment and let it transmit. The network detects it through your gate (up to a ~90 min window — plenty of time to finish setup).
- Accept your invite. You're emailed a Grafana invite — set a password and your dashboard(s) are live. You can remove the code from your comment afterwards.
Prefer to run your own?
The whole stack — syslog parsing in Node-RED, InfluxDB storage and the Grafana dashboard — is documented as a step-by-step build guide.
🛠️ Build your own LoRa-APRS dashboard